Software Dyno for FlashPro users (and maybe KPro)
#1
UPDATED SOFT DYNO AT POST 74.
I purchased my FlashPro on the first day it was available, and soon realized that the datalogs contained a high enough sample rate to generate a torque plot. It uses the same principal as a dynojet, since it just measures the change in speed of a fixed load over time. All you need is Microsoft Excel to use it.
Obviously, there are advantages and disadvantages of a conventional dyno compared to a software dyno, but if you follow the steps below, you'll get very repeatable results. At the very least, you'll be able to get a MUCH better tune on the street, and won't have to pay for a bunch of dyno time.
1) Find a smooth, flat road where you can safely accellerate at full throttle from about 3K RPMs to redline in 3rd gear.
2) Standardize your testing method so that you always go full throttle at the same spot on the road at the same speed in the same direction.
3) Never try to compare runs that were recorded from different locations, since minor changes in the road will change the torque curve.
4) Make sure the total vehicle weight is consistent between runs that you plan to compare (same fuel level, same contents, no passengers, etc.).
5) Make sure there is no head or tail wind when you do the pull
6) Make sure the A/C is off and the top and windows are up.
7) Keep tire pressures consistent between runs you plan to compare.
8) Make sure the whole drivetrain is fully warmed up, but not heat soaked.
9) Do multiple pulls at a time, and throw out runs that look inconsistent.
10) The actual torque and HP numbers are technically unitless, so don't use these numbers to quote ft-lbs and rwhp to your friends. The numbers are just for reference. I haven't put my car on a conventional dyno yet, so I don't know if these numbers are closer to a DynaPack, DynoJet, or Mustang Dyno, but my goal is for them to be more like a DynoJet.
Here's what it looks like. The solid lines are the torque lines, and the thin dashed lines are the fuel injector pulse widths. Ideally, torque should follow fuel (except at high RPMs), so if your fuel lines don't resemble your torque lines, then there may be something wrong with your tune.
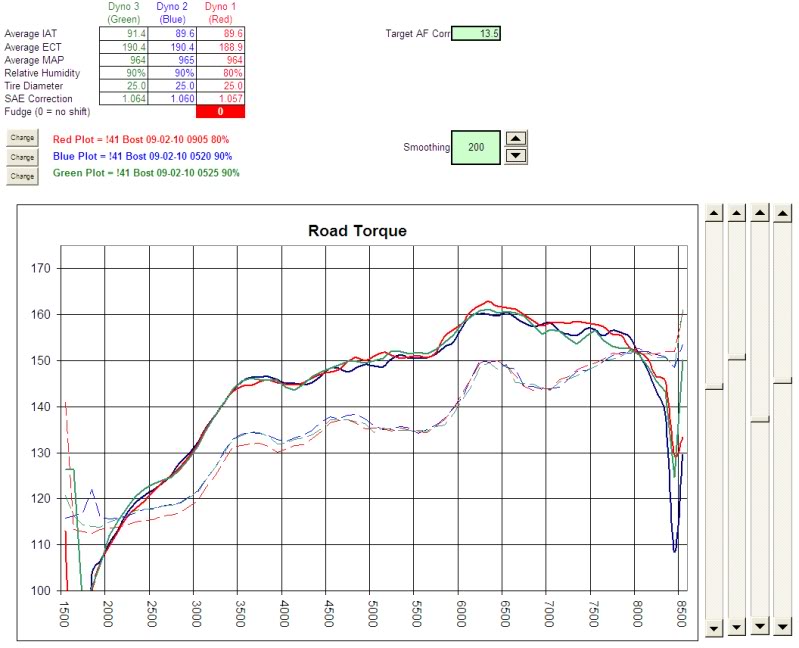
The SAE correction values are based on IAT, MAP, and relative humidity. You will have to provide the relative humidity by looking at the local weather. If you put the humidity percent as the very end of the datalog filename (ie. DynoPull 45%.csv), the import procedure will grab it automatically. Since IAT is used for the SAE correction instead of the actual ambient temperature, you need to make sure the intake isn't heat soaked. You also need to override those values if you are trying to test the effectiveness of a CAI.
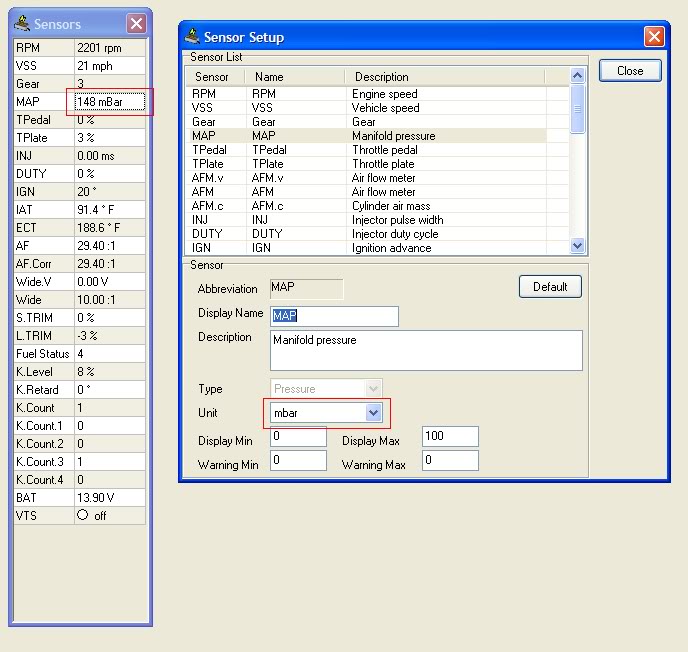
NOTE: The SAE correction formula expects MAP to be in mBar, which is not the default in FlashPro Manager. If you don't change the units in FlashPro Manager, the graphs will not display correctly at all. Here is where you need to change it by double-clicking on the Sensor window next to MAP.
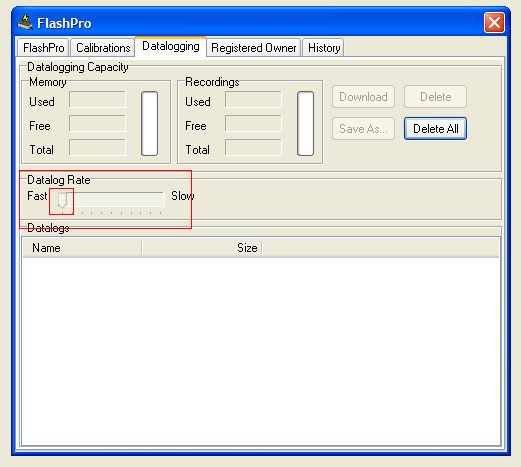
You can play around with different sample rates, but I believe the fastest sample rate might give the best graph.
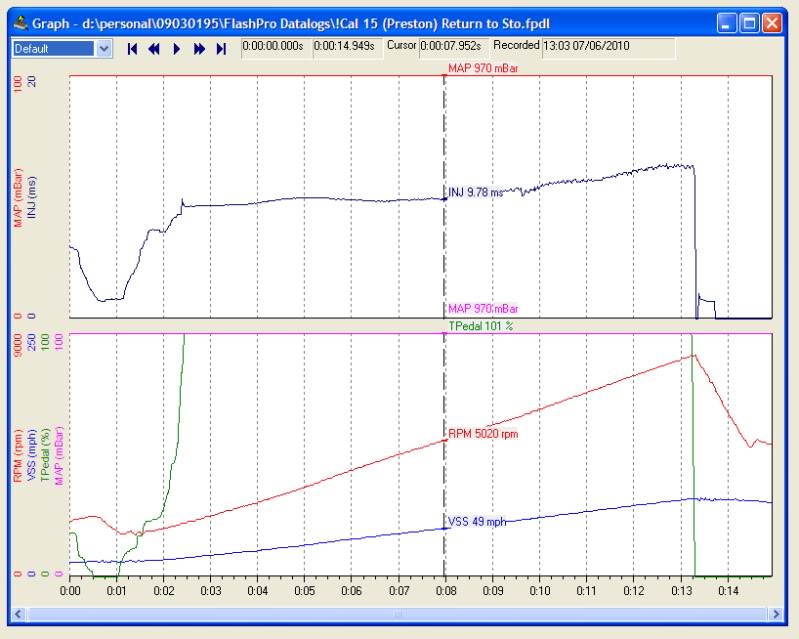
The datalog needs to just contain a single 3rd gear pull. Press the datalog button a couple seconds before going full throttle, then push it again a couple seconds after lifting off the throttle. Here is what the datalog should look like before you export it to a CSV file (Datalog -> Export).
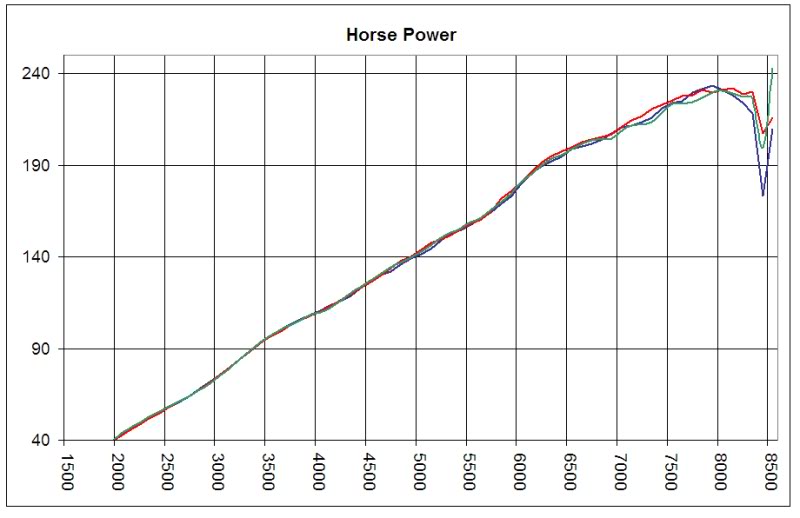
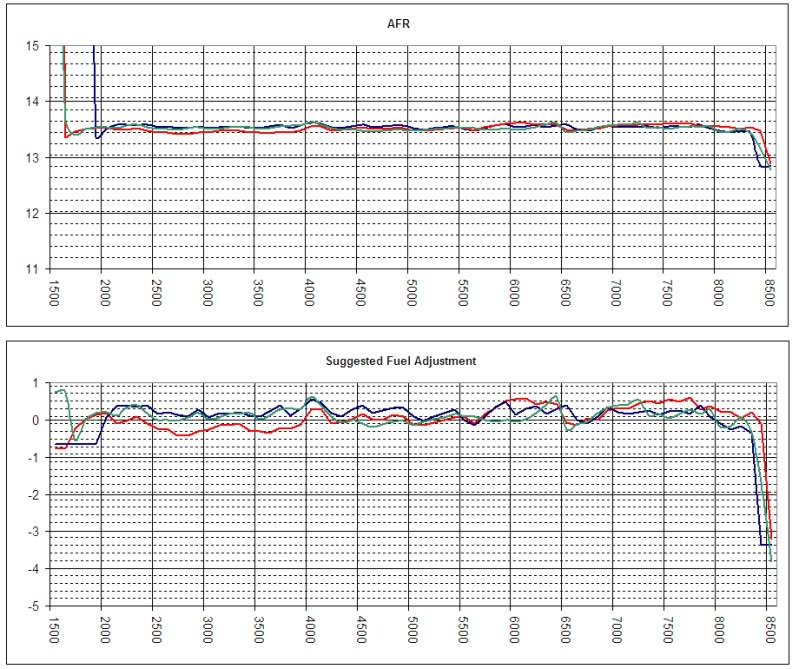
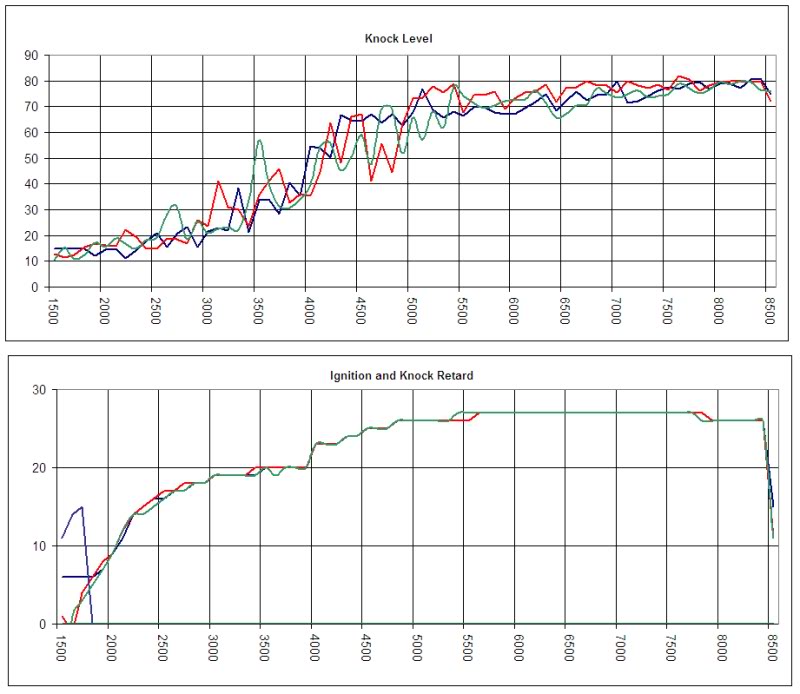
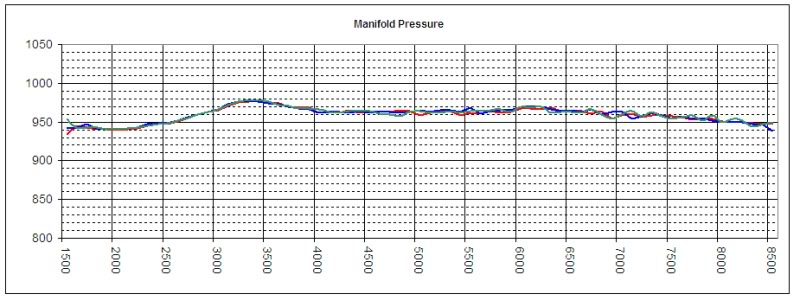
Here are some other graphs you'll see. Horsepower is just calculated from the torque.
Anyway, here it is for download. Feel free to try it out, and let me know what you think. If you have any suggestions for new features or bug fixes, please let me know. BTW, don't judge my coding skills based on this VBA. I moved on to .NET years ago, so I was surprised at how much VBA I had forgotten.
I purchased my FlashPro on the first day it was available, and soon realized that the datalogs contained a high enough sample rate to generate a torque plot. It uses the same principal as a dynojet, since it just measures the change in speed of a fixed load over time. All you need is Microsoft Excel to use it.
Obviously, there are advantages and disadvantages of a conventional dyno compared to a software dyno, but if you follow the steps below, you'll get very repeatable results. At the very least, you'll be able to get a MUCH better tune on the street, and won't have to pay for a bunch of dyno time.
1) Find a smooth, flat road where you can safely accellerate at full throttle from about 3K RPMs to redline in 3rd gear.
2) Standardize your testing method so that you always go full throttle at the same spot on the road at the same speed in the same direction.
3) Never try to compare runs that were recorded from different locations, since minor changes in the road will change the torque curve.
4) Make sure the total vehicle weight is consistent between runs that you plan to compare (same fuel level, same contents, no passengers, etc.).
5) Make sure there is no head or tail wind when you do the pull
6) Make sure the A/C is off and the top and windows are up.
7) Keep tire pressures consistent between runs you plan to compare.
8) Make sure the whole drivetrain is fully warmed up, but not heat soaked.
9) Do multiple pulls at a time, and throw out runs that look inconsistent.
10) The actual torque and HP numbers are technically unitless, so don't use these numbers to quote ft-lbs and rwhp to your friends. The numbers are just for reference. I haven't put my car on a conventional dyno yet, so I don't know if these numbers are closer to a DynaPack, DynoJet, or Mustang Dyno, but my goal is for them to be more like a DynoJet.
Here's what it looks like. The solid lines are the torque lines, and the thin dashed lines are the fuel injector pulse widths. Ideally, torque should follow fuel (except at high RPMs), so if your fuel lines don't resemble your torque lines, then there may be something wrong with your tune.

The SAE correction values are based on IAT, MAP, and relative humidity. You will have to provide the relative humidity by looking at the local weather. If you put the humidity percent as the very end of the datalog filename (ie. DynoPull 45%.csv), the import procedure will grab it automatically. Since IAT is used for the SAE correction instead of the actual ambient temperature, you need to make sure the intake isn't heat soaked. You also need to override those values if you are trying to test the effectiveness of a CAI.
NOTE: The SAE correction formula expects MAP to be in mBar, which is not the default in FlashPro Manager. If you don't change the units in FlashPro Manager, the graphs will not display correctly at all. Here is where you need to change it by double-clicking on the Sensor window next to MAP.

You can play around with different sample rates, but I believe the fastest sample rate might give the best graph.

The datalog needs to just contain a single 3rd gear pull. Press the datalog button a couple seconds before going full throttle, then push it again a couple seconds after lifting off the throttle. Here is what the datalog should look like before you export it to a CSV file (Datalog -> Export).

Here are some other graphs you'll see. Horsepower is just calculated from the torque.


Anyway, here it is for download. Feel free to try it out, and let me know what you think. If you have any suggestions for new features or bug fixes, please let me know. BTW, don't judge my coding skills based on this VBA. I moved on to .NET years ago, so I was surprised at how much VBA I had forgotten.
#2
we had a discussion on this over on 8thcivic.com a little over a week ago. i said it there and i'll say it here. there is no way you're going to magically guess the ignition timing on the road with simple formulas.
i don't mind street tuning a simple bolt-on setup but there is no way you're going to extract max hp without dialing in the ignition timing tables on a dyno with a fixed amount of load.
dial in the fuel on the street. pay for 1-2 hours of dyno time and dial it in on the dyno. no worrying about bumps on the road. no worrying about getting pulled over for speeding.
#4
The dyno plot just shows what the IGN value was in the datalog. It does NOT make suggestions for optimizing the ignition timing at all. If you want to tweak ignition timing for more power, this spreadsheet is just going to display the results. I don't know if I've necessarily found my perfect ignition timing, but I know that moving my timing up or down a degree doesn't change the power output.
#6
Originally Posted by gernby,Sep 8 2010, 10:40 AM
The dyno plot just shows what the IGN value was in the datalog. It does NOT make suggestions for optimizing the ignition timing at all. If you want to tweak ignition timing for more power, this spreadsheet is just going to display the results. I don't know if I've necessarily found my perfect ignition timing, but I know that moving my timing up or down a degree doesn't change the power output.
you'd know on a dyno.
#7
as far as the thread on 8thcivic.com goes. here's the link:
http://www.8thcivic.com/forums/hondata/225...ter-e-tune.html
http://www.8thcivic.com/forums/hondata/225...ter-e-tune.html
Trending Topics
#8
Originally Posted by b.r.i.a.n.,Sep 8 2010, 01:50 PM
i'm sure you're in the vicinity of mbt but how do you know if you've gone past that or if you haven't gotten there yet?
you'd know on a dyno.
you'd know on a dyno.
I believe the biggest advantage of a software dyno is that you know the drivetrain is at normal operating temperature. This seems to be a huge weakness for conventional dynos, since I believe you are gauranteed to be tuning the car while it's NOT at normal operating temperature. With the software dyno, you are also gauranteed to have results based on the natural air flow around the car, and not just a fan with an open hood (bad for testing different intakes).
BTW, I forgot to mention that this spreadsheet will require some tweaking for FI users. The SAE calculations will be totally wrong, due to the inflated MAP and IAT numbers. My suggestion for FI users is to just disable the SAE corrections by replacing the SAE correction formula with a "1". You'll also need to adjust the scale of the graphs, since you'll be making more power.
#10
I'll admit that using a software dyno for tuning on the street is probably best left to the NA guys with just I/H/TP/E, since there are already some decent starting calibrations available from Hondata. If I had a turbo, I don't think I'd want to try tuning it myself at all.


 I'll sticky this and will also try it sometime.